Roll Inspector
Roll Inspector is a web page per environment that shows what a request did across Varnish, nginx, PHP, Valkey or Redis, RabbitMQ, the database and the search engine. You open it when a page is slow, a cache misses or a queue backs up. It also offers a few write actions, such as purging a Varnish tag.
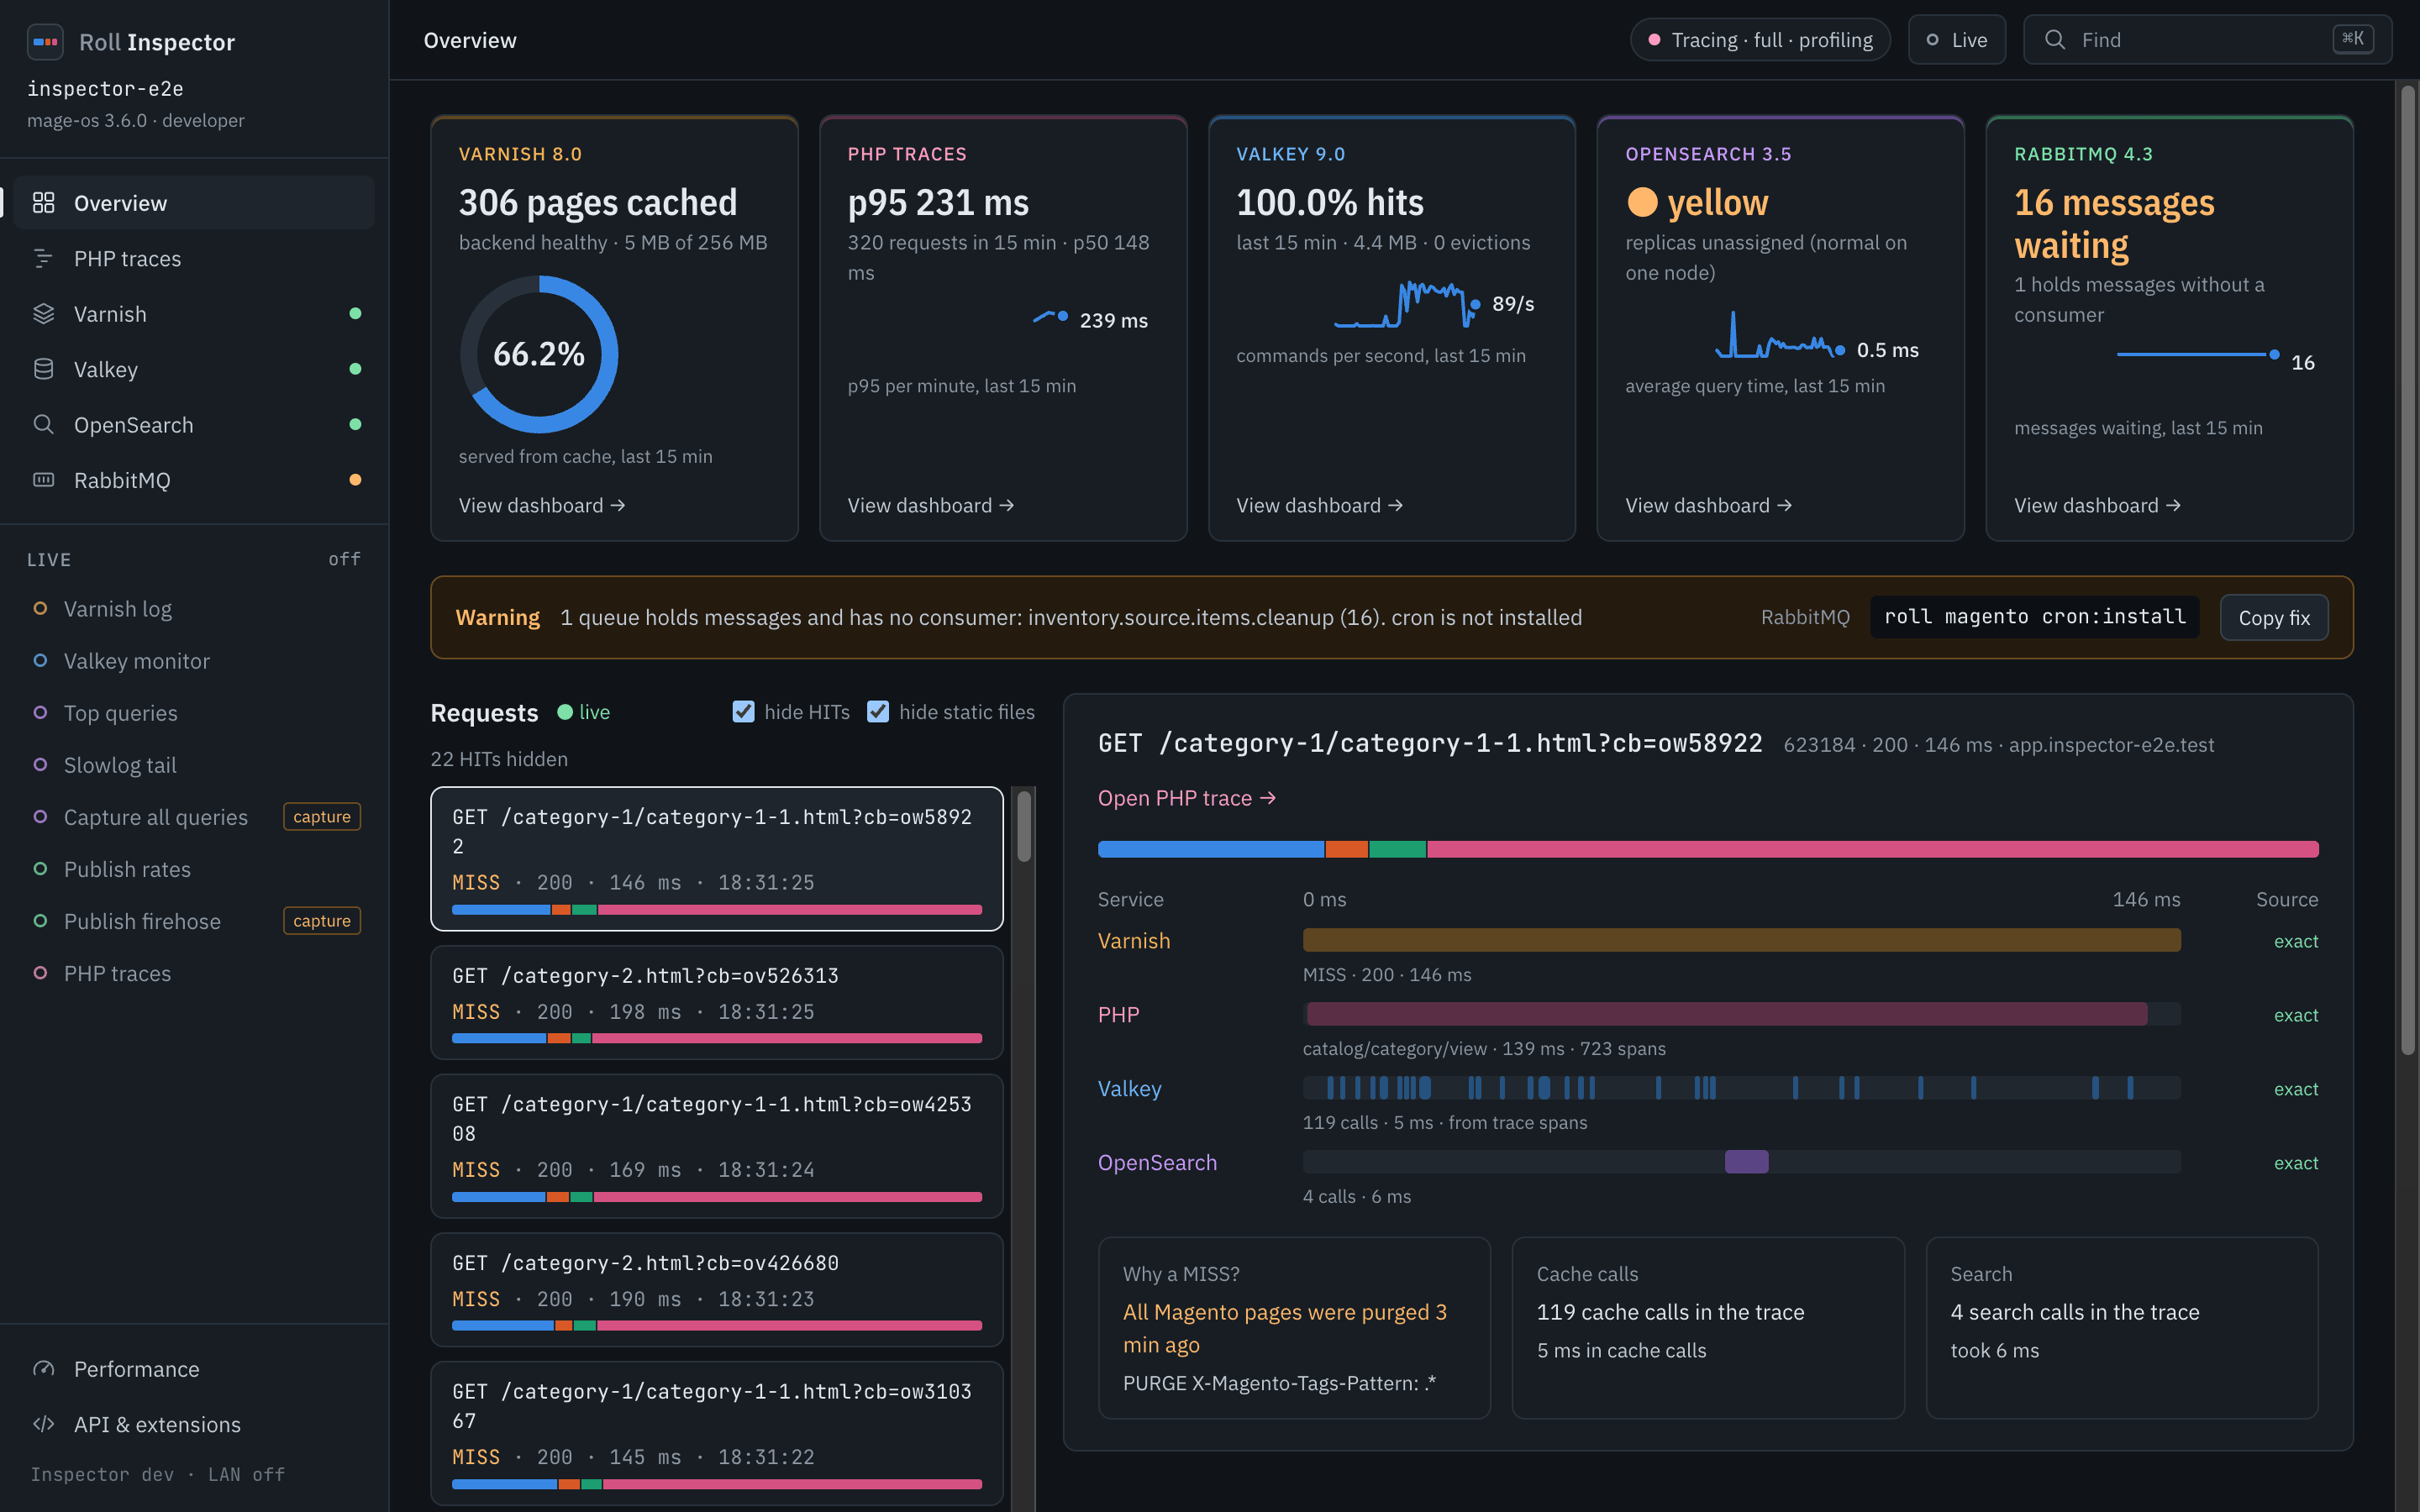
The Overview shows one card per service, the RabbitMQ no-consumer warning, and the live request list. The cost strip under the selected request splits its time into SQL, cache, search, HTTP and PHP.
The Varnish hit rate is hit / (hit + miss + pass) everywhere: the Health card, the donut, the Overview tile and /api/v1. Passes count as requests that were not cacheable, so a shop with many passes shows a lower rate than a hits-against-misses ratio would. The Valkey hit ratio is hits / (hits + misses) with Inspector’s own lookups left out, on the Health card, the donut and the Overview tile alike. Each service has one definition. On a service dashboard the KPI follows the window picker and the lifetime ratio sits beside it; the Overview tiles cover the last 15 minutes.
With tracing on, the Valkey lane on the Overview comes from the trace’s cache spans, captioned “from trace spans”, and Inspector does not run MONITOR. It uses MONITOR only when tracing is off, or when you start the “Valkey monitor” stream in the live drawer yourself. When the image updates under an open tab, a bar at the top reads “Inspector was updated” with a Reload button.
Switch it on
Set the toggles in .env.roll, then run roll env up.
| Key | Default | Notes |
|---|---|---|
ROLL_INSPECTOR |
0 |
1 adds the inspector service at https://inspector.<TRAEFIK_DOMAIN> |
ROLL_INSPECTOR_TRACE |
0 |
1 loads the tracer in php-fpm. Needs ROLL_INSPECTOR=1. Cannot be combined with ROLL_NEWRELIC=1 |
ROLL_INSPECTOR_TRACE_DEBUG |
0 |
1 also traces php-debug. Needs ROLL_INSPECTOR_TRACE=1 |
ROLL_INSPECTOR_PROFILE |
off |
excimer adds sampling profiles for the flame graph. Needs ROLL_INSPECTOR_TRACE=1, otherwise profiling stays off with a warning |
ROLL_INSPECTOR_TRACE_DETAIL |
full |
lean drops the Magento block, event and plugin spans and keeps the request, SQL, cache, HTTP and search spans. Lean traces group under the same route as full traces of that page |
ROLL_INSPECTOR_SAMPLE |
10 |
Seconds between metrics samples for the Health dashboards: 10, 30, 60 or off |
ROLL_INSPECTOR_VERSION |
latest |
Image tag of inspector |
A minimal setup that traces every PHP request:
ROLL_INSPECTOR=1
ROLL_INSPECTOR_TRACE=1
Roll refuses combinations that cannot work. The trace, debug and profile keys error out without ROLL_INSPECTOR=1, and ROLL_INSPECTOR_TRACE errors out next to ROLL_NEWRELIC=1.
Commands
roll inspector            # same as: roll inspector open
roll inspector open
roll inspector status
roll inspector trace on
roll inspector trace off
openopenshttps://inspector.<TRAEFIK_DOMAIN>in your browser (openon macOS,xdg-openon Linux) and prints the URL.statusshows every toggle above exceptROLL_INSPECTOR_VERSION, the container state and health, and whether your php-fpm image supports tracing and profiling.trace on|offswitches tracing in the running containers and reloads FPM. The change lasts until the php containers restart.roll env restart php-fpmreturns to the.env.rollvalues.
Lifecycle
roll env up creates a gate secret in ~/.roll/inspector/<env>.secret (mode 600) the first time ROLL_INSPECTOR=1 is set. Delete the file and run roll env up to get a new one. Inspector refuses to start with a secret shorter than 32 characters.
roll env down and a bare roll env stop stop Inspector first. That lets it put back any capture it switched on (the OpenSearch slowlog at 0 ms, RabbitMQ tracing) before those services go away. roll env stop opensearch (or elasticsearch, rabbitmq) does the same and starts Inspector again afterwards. Set ROLL_INSPECTOR=0 and the next roll env up or down stops and removes the leftover container. roll env stop only stops it.
In this section
How it works: the architecture, tracing and profiling, and what each switch turns off.
Finding a bottleneck: a walkthrough from the route list to the slow span, plus keyboard shortcuts.
Service dashboards: Varnish, Valkey, OpenSearch and RabbitMQ.
Performance: what Inspector costs and what to switch off first.
API and browser integrations:
/api/v1, the userscript, the DevTools extension and the MCP tools.